Worldwide Regulated Open-End Fund Assets and Flows
Fourth Quarter 2023
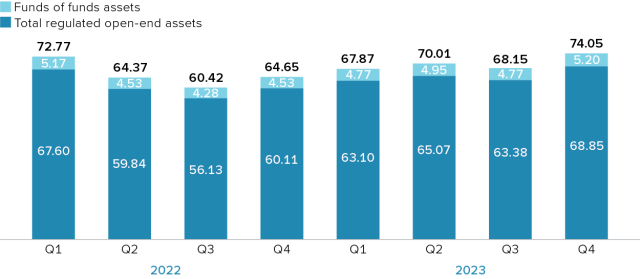
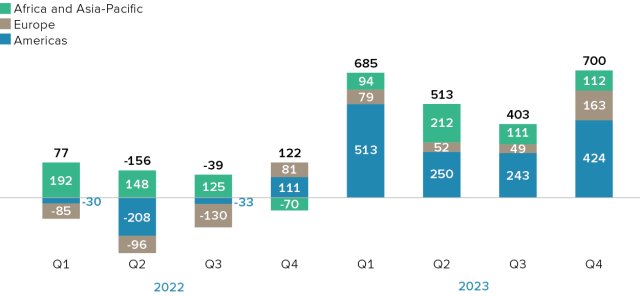
Washington, DC; March 22, 2024—Worldwide regulated open-end fund assets increased 8.6 percent to $68.85 trillion at the end of the fourth quarter of 2023, excluding funds of funds. Worldwide net cash inflow to all funds was $700 billion in the fourth quarter, compared with $403 billion of net inflows in the third quarter of 2023.
The Investment Company Institute compiles worldwide regulated open-end fund statistics on behalf of the International Investment Funds Association (IIFA), the organization of national fund associations. The collection for the fourth quarter of 2023 contains statistics from 45 jurisdictions.
Worldwide Assets of Regulated Open-End Funds
Trillions of US dollars, end of quarter

Note: Regulated open-end funds include mutual funds, exchange-traded funds, and institutional funds.
The growth rate of total regulated open-end fund assets reported in US dollars was increased by US dollar depreciation over the fourth quarter of 2023. For example, on a US dollar–denominated basis, fund assets in Europe increased by 9.3 percent in the fourth quarter, compared with an increase of 4.7 percent on a euro-denominated basis.
Net Assets of Worldwide Regulated Open-End Funds
Billions of US dollars
| 2022 | 2023 | |||||||
| Q1 | Q2 | Q3 | Q4 | Q1 | Q2 | Q3 | Q4 | |
| All funds* | 67,604 | 59,842 | 56,132 | 60,113 | 63,103 | 65,069 | 63,383 | 68,851 |
|
Long-term |
58,960 | 51,363 | 47,837 | 51,265 | 53,645 | 55,351 | 53,439 | 58,410 |
|
Equity |
31,633 | 26,619 | 24,758 | 26,958 | 28,449 | 29,760 | 28,641 | 31,787 |
|
Bond |
13,049 | 11,888 | 11,252 | 11,529 | 11,991 | 12,209 | 11,971 | 12,893 |
|
Balanced/Mixed |
8,193 | 7,249 | 6,583 | 7,027 | 7,291 | 7,282 | 6,893 | 7,295 |
|
Guaranteed |
33 | 28 | 26 | 30 | 32 | 33 | 35 | 37 |
|
Real Estate |
1,380 | 1,313 | 1,258 | 1,366 | 1,371 | 1,385 | 1,342 | 1,395 |
|
Other |
4,672 | 4,266 | 3,960 | 4,356 | 4,510 | 4,682 | 4,558 | 5,003 |
|
Money market |
8,643 | 8,479 | 8,295 | 8,848 | 9,458 | 9,718 | 9,943 | 10,441 |
| Memo items included above: | ||||||||
|
ETFs |
9,691 | 8,523 | 8,082 | 8,943 | 9,544 | 10,122 | 9,963 | 11,281 |
|
Institutional |
5,661 | 5,012 | 4,685 | 5,105 | 5,292 | 5,330 | 5,170 | 5,581 |
*Excludes Funds of Funds where possible
On a US dollar–denominated basis, equity fund assets increased by 11.0 percent to $31.79 trillion at the end of the fourth quarter of 2023. Bond fund assets increased by 7.7 percent to $12.89 trillion in the fourth quarter. Balanced/mixed fund assets increased by 5.8 percent to $7.30 trillion in the fourth quarter, while money market fund assets increased by 5.0 percent globally to $10.44 trillion.
Percentage of Worldwide Regulated Open-End Fund Assets
| By type of fund, 2023:Q4 | By region, 2023:Q4 |

At the end of the fourth quarter of 2023, 46 percent of worldwide regulated open-end fund assets were held in equity funds. The asset share of bond funds was 19 percent and the asset share of balanced/mixed funds was 11 percent. Money market fund assets represented 15 percent of the worldwide total.
By region, 54 percent of worldwide assets were in the Americas in the fourth quarter of 2023, 31 percent were in Europe, and 14 percent were in Africa and the Asia-Pacific regions.
Net Sales of Worldwide Regulated Open-End Funds
Billions of US dollars
| 2022 | 2023 | |||||||
| Q1 | Q2 | Q3 | Q4 | Q1 | Q2 | Q3 | Q4 | |
| All funds | 77 | -156 | -39 | 122 | 685 | 513 | 403 | 700 |
|
Long-term |
289 | -180 | -55 | -210 | 124 | 200 | 128 | 345 |
|
Equity |
198 | -69 | -80 | -51 | 9 | -30 | 61 | 191 |
|
Bond |
-56 | -122 | 42 | -123 | 145 | 226 | 108 | 152 |
|
Balanced/Mixed |
85 | -51 | -48 | -50 | -58 | -55 | -68 | -80 |
|
Guaranteed |
-1 | -2 | * | 2 | 1 | 1 | -1 | * |
|
Real Estate |
-2 | 11 | 11 | 15 | 4 | 6 | 5 | * |
|
Other |
65 | 52 | 19 | -2 | 22 | 51 | 23 | 82 |
|
Money market |
-212 | 24 | 17 | 332 | 562 | 314 | 275 | 355 |
| Memo Items Included Above: | ||||||||
|
ETFs |
298 | 158 | 143 | 260 | 147 | 225 | 220 | 377 |
|
Institutional |
86 | 49 | 66 | 20 | -2 | 36 | 30 | 27 |
* Indicates an amount that is less than $0.500 million.
Note: 43 jurisdictions reported data in Q1 2022 through Q4 2023. Assets of reporting jurisdictions represented 96 percent of assets of all jurisdictions at the end of 2023: Q4. Net sales are new sales plus reinvested dividends less redemptions plus net exchanges. Components may not add to the total because of rounding or unclassified funds. Funds of funds are excluded where possible.
Net sales of regulated open-end funds worldwide were $700 billion in the fourth quarter of 2023. Flows into equity funds worldwide were $191 billion in the fourth quarter, after experiencing $61 billion of net inflows in the third quarter of 2023.
Globally, bond funds posted an inflow of $152 billion in the fourth quarter of 2023, after recording an inflow of $108 billion in the third quarter.
Outflows from balanced/mixed funds worldwide totaled $80 billion in the fourth quarter of 2023, compared with $68 billion of outflows in the third quarter of 2023.
Worldwide Net Sales of Regulated Open-End Funds by Region
Billions of US dollars

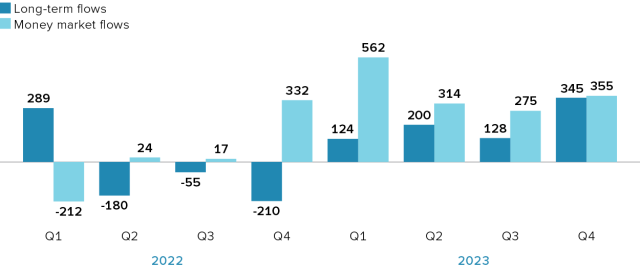
Worldwide Long-Term and Money Market Net Sales
Billions of US dollars

Money market funds worldwide experienced an inflow of $355 billion in the fourth quarter of 2023 after registering an inflow of $275 billion in the third quarter of 2023.

